What Impact Will the Next PM Have on House Prices?
Are Conservative or Labour PMs Better for the Housing Market?
Whatever stage of life you’re in, housing will likely play an important role in your personal affairs. By looking at how Conservative and Labour governments have performed in the past, we may help you decide which party (if any!) you should vote for in a future election.
In particular, we wanted to see how house price growth rose and fell with each prime minister (and each political party) and assess whether it was social and economic events that rocked the property market or particular governments’ housing policies. The house price data ranges from Q4 1973 to today.
Average House Prices Graph
The below graph shows how house prices have changed over time, showing both figures with and without inflation.
You can hover over the line at any given point to view the house price index for each quarter.
How do Labour and the Conservatives Affect House Prices?
Since we’ve only had Labour or Conservative prime ministers in the past five decades, we’ve assessed how the prime ministers of each party have influenced house prices across the UK.
We measured the house price growth at the beginning and end of each prime minister’s term and combined them for each political party.
How are Different Regions Affected?
Unsurprisingly, different UK regions have been affected in differing ways by the various governments that have been in power. Check out the graph below to see how house prices in your region changed over time:
How did the Different Regions Fare under Conservatives and Labour?
The image below shows the regions that saw the highest and lowest house price growth under Labour and Conservative governments. Unsurprisingly for many, London, the commuter belt and the South East saw a disproportionate increase in house prices under the Conservatives, compared to Scotland, the North and Northern Ireland.
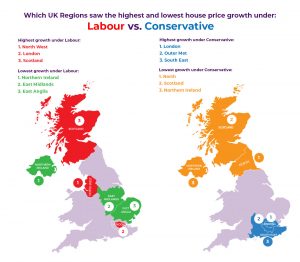
Whilst different regions saw greater or lesser house price growth under the same governments compared to others, all except Northern Ireland saw greater house price growth under Labour.
The Prime Ministers
Take a walk through the prime ministers of the past (and not so distant past) to find out whether Conservative or Labour leaders are more beneficial for the housing market, which prime minister built the fewest homes of the past century, and the prime minister that oversaw the highest house price growth of the last five decades…
1974-76: Harold Wilson
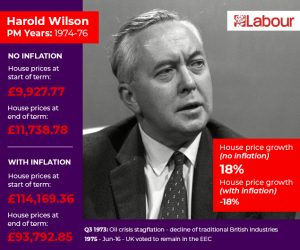
During the Labour government of Harold Wilson, the proportion of council housing across the country rose from 42% to 50%. With a higher number of households living in council homes, property values in the UK fell by 18% (when adjusted for inflation). If we don’t adjust for inflation, house prices rose by an average of 18%.
However, inflation outstripped house price growth in 1975, when it soared to 24.11% – the highest of all the prime ministers we studied. In the same year, property values grew by 11%.
If you want to reminisce about how cheap homes were back in the 70s, you’ll love the following data: the average property cost just £9,928 when Wilson became prime minister. In 2018, a typical deposit was more than double, at around £20,000!
During Wilson’s time as PM, the West Midlands suffered the lowest average house price growth (3.29%), while Northern Ireland kickstarted a reign of impressive increases (30.42%).
Fun fact: The UK’s membership of the European Economic Community (EEC) was endorsed by a referendum in 1975.
1976-79: James Callaghan
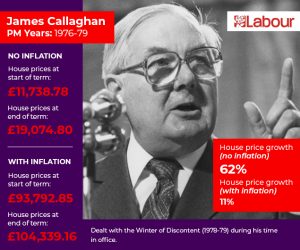
Wilson was succeeded by the fellow Labour government of James Callaghan, who dealt with the Winter of Discontent (1978-79) during his time in office. Despite the strikes by public sector trade unions, house prices rose by an average of 11% (when adjusted for inflation) between 1976-79.
While inflation dropped from 16.77% (1976) to 8.28% (1978) during Callaghan’s premiership, house price growth skyrocketed from an average of 8% to 28% over the same period.
If we don’t adjust the figures, a typical property value soared by 62%, to £19,075 (still not as much as a deposit today!). All regions experienced fairly regular growth of around 30-40%.
1979-90: Margaret Thatcher
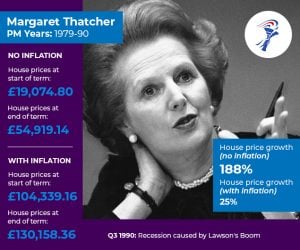
While the Conservative’s Margaret Thatcher suffered a recession in her second year as prime minister, she was busy building the Right to Buy scheme, which was introduced in October 1980.
Although the Falklands War rocked the nation in 1982, Thatcher oversaw the highest average annual house price growth of the past five decades, at 29%, in 1988, before dealing with another recession in 1990. Nevertheless, she managed to curb sky-high inflation, which stood at just 3.91% in 1988 (down from 13.35% at the beginning of her term).
Northern Ireland was a standout region yet again, but, despite its gains of 26.82% during Thatcher’s premiership (not adjusted for inflation), other areas experienced growth in the 60% region, while the North West (70.34%), East Midlands (70.18%) and East Anglia (70.02%) stood out.
With her homeownership ideals pushing house prices up by the highest annual level of all the prime ministers we studied, was Thatcher the most successful leader in creating movement in the property market, or was her controversial policy damaging in the long-term?
1990-97: John Major
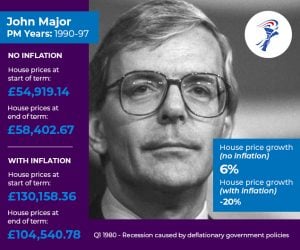
When fellow Conservative John Major succeeded Thatcher in 1990, he wasn’t in for the positive property market that she grew. Instead, the average house price dropped by 20% (when adjusted for inflation) during Major’s time in office. At the same time, inflation fell significantly, from 7.02% in 1990 to 1.95% in 1994.
Major’s fate was perhaps decided by the infamous Black Wednesday of September 1992, when his government was forced to withdraw the pound from the European Exchange Rate Mechanism.
If we don’t adjust for inflation, Major’s government oversaw positive house price growth, albeit of just 6%. Not adjusting for inflation, Northern Ireland returned to strength during Major’s premiership (41.51%), whereas low growth was seen across Yorkshire and the Humber (2.89%), the South West (2.65%) and North West (0.41%), while declines were recorded in the North (-3.66%), East Midlands (-3.41%) and East Anglia (-0.49%).
1997-2007: Tony Blair
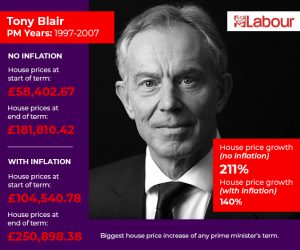
It was a return to Labour in 1997 under Tony Blair’s government. During his ten-year residency in Parliament, Blair witnessed house prices soar, by a staggering 140% (when adjusted for inflation). If we don’t adjust the figures, growth was even more impressive, at 211%. This meant that house price growth massively outstripped inflation, hitting an average of 25% in 2002, compared to the Consumer Price Index (CPI) of 1.24%.
These gains in property values may be due to Blair’s extensive range of housing policies, including:
- 1999: Urban renaissance programme
- 2000: Decent Homes scheme
- 2001: National Strategy for Neighbourhood Renewal
- 2002: Commonhold and Leasehold Reform Act
- 2003: Housing Market Renewal
It was Northern Ireland that stood out, yet again, with growth of 77.50% (not adjusted for inflation), compared to about 60% elsewhere.
2007-10: Gordon Brown
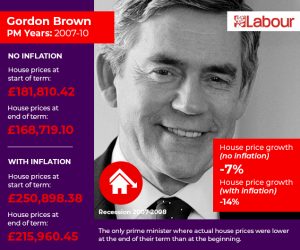
Blair’s successor, Gordon Brown, was less triumphant. During his stay in No. 10, house prices dropped by an average of 14% (adjusted for inflation). However, his Labour policies cannot be solely blamed for these declines; the financial crisis of 2007-08 hit the country hard during Brown’s time as prime minister.
As a result, Brown recorded the lowest annual house price growth of all the prime ministers we assessed, at an average of – 15% in 2008. At the same time, the CPI had risen to 3.52%.
If we don’t adjust for inflation, all regions experienced house price declines from 2007-2010, with Northern Ireland taking the biggest hit (-74.97%) and London faring the best (-0.74%).
2010-16: David Cameron
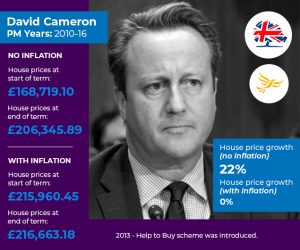
David Cameron moved into Downing Street with the Liberal Democrat’s Nick Clegg at his side in the Conservative’s coalition government. His tenure saw some ups and downs, from the 2011 London riots to the Olympics in 2012. In 2013, the Help to Buy scheme was introduced.
Following a general election, Cameron’s majority government pressed onwards. Following in Thatcher’s footsteps, the prime minister scrapped the affordable rental housing scheme in favour of building more starter homes. Nevertheless, his efforts were unsuccessful, as Cameron built the fewest homes of all prime ministers since 1923. Unsurprisingly, this caused house price growth to stagnate, at 0% (adjusted for inflation). While house prices fell and then returned to growth at the end of Cameron’s premiership, inflation plummeted from a high of 3.85% (2011) to just 0.37% (2015).
However, Scotland was the only region to record an average decrease (-0.58%), when we don’t adjust for inflation, while the Outer Met and London regions witnessed significant growth (31.55% and 38.86% respectively).
But it was June 2016 that cemented Cameron’s legacy – the country voted to leave the EU in a now notorious referendum.
2016-19: Theresa May
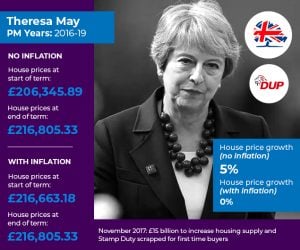
Following Cameron’s resignation over the referendum result, Theresa May filled his shoes. She was forced to partner with the DUP (Democratic Unionist Party) following a general election in June 2017 and faced the world as the country’s leader when the Grenfell Tower fire shocked us all just three days later.
May’s government appeared to introduce positive housing policy following the disaster, including:
- November 2017: £15 billion to increase housing supply and Stamp Duty scrapped for first-time buyers
- March 2019: Homes (Fit for Human Habitation) Act
- April 2019: Section 21 to be scrapped
Regardless, house price growth didn’t move on from Cameron’s 0% during May’s time in office (adjusted for inflation), while inflation picked up to 2.29% (2018). Not adjusting the data, London was the only region to show a decline (-3.05%), while the Midlands and Northern Ireland were buoyant.
2019: Boris Johnson
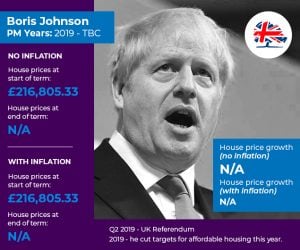
Although it’s yet to be seen how the Conservative’s Boris Johnson will affect house price growth, we can already predict his effect on the market, after he cut targets for affordable housing this year.
Johnson’s main focus, at present, will be the general election, which was called back in October.

General election
If you’re unsure of who to vote for in the 12th December general election, and are particularly concerned about the housing market, then perhaps this data may help. This comprehensive overview of each party’s manifestos may also be useful.
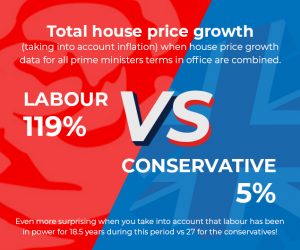
Overall, when we look back to 1974-2019, during four different Labour prime ministers, growth has actually substantially outstripped that of the Conservative leaders. Total combined house price growth under Labour prime ministers is equal to 119%, while the Conservatives have achieved just 5% (both adjusted for inflation).
Furthermore, out of the 13 regions of the UK, just one (Northern Ireland) performed better under the Conservatives. Nevertheless, more regions experienced their highest house price growth under a Conservative prime minister than a Labour one, although this appears to be due to Margaret Thatcher’s substantial term in office.
Of course, varying social and economic conditions must be taken into account during these periods, but the data does challenge a couple of commonly held misconceptions, namely:
- House prices increase under Conservative governments, and
- Conservatives are the reason first time buyers get priced out of the market
Are house price increases even a good thing? It all depends on the individual asking the question.
Sources of data:
Nationwide House Price Index
