How High Is The Flood Risk To Your Home?

Climate change and flood risks have always been hot topics, but with more frequent floods in recent years, they’ve taken on a new level of prominence in the hearts and minds of many British voters.
With this being the case, we’ve created an online tool highlighting which parts of England are most at risk from rising sea and river levels during extreme weather.
This data is based on data from the Environment Agency that estimates flood risk for homes based on historic flood data and has been narrowed down to a county, local authority and constituency level. The analysis also reveals whether the local MPs in a given county have voted in favour or against legislation to combat climate change.
Why we created the English Flood Predictor
Although we’re politically agnostic, we believe the electorate deserves transparency on this topic, especially given the extreme weather events of recent years and the fervent environmental protests.
Most MPs will tell you the environment is a cause close to their heart, but does their voting history on climate change measures reflect this?
How to use the tool
Select your county from the dropdown menu and hit the ‘Find out more’ button. Our English Flood Predictor tool will provide you with data highlighting the flood risk to your home, as well as how your local MP votes on legislation that could help prevent this.
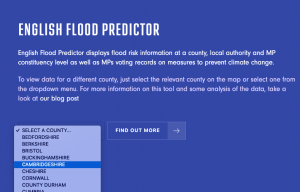
The data for each county has been broken down by constituency and arranged into tables which show what percentage of homes in each constituency lie within ‘high risk’ areas, in addition to the number of homes that lie within any risk category (‘high’, ‘medium’, ‘low’ to ‘very low’) and which way the seated MP has typically voted.
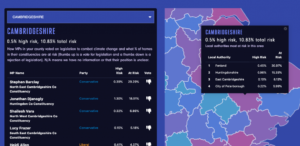
an infographic about how different MPs in Cambridgeshire voted on legislation to combat climate change
- Data calculated for the entire county is found at the top
- Data for MP constituencies is in the table on the left
- Data for local authorities within the county in the table over the map on the right
You can browse data from other counties directly from this screen by selecting them on the interactive map over on the right. You can also view flood tables ranking the constituencies with the highest proportion of homes at risk by clicking the blue and pink house-shaped icons on the left of the screen.
This data behind this tool understates the risk!
We contacted the Environment Agency while initially researching the data to better understand what it means.
Firstly, it only takes into account the risks from rivers and the sea, so other sources of flooding aren’t included.
Secondly, “the data is based on present-day climate conditions and uses historically recorded sea levels and river flows to help estimate the magnitude of extreme weather events.
“[It] does not include climate change predictions,” but the Environment Agency is currently working on a new national flood risk assessment for England which will “include climate change information.” The new data is not expected to be compiled until 2023/2024.
Which parts of England are most at risk from flooding?
We’ve used our Flood Predictor to analyse which parts of England are most at risk during extreme weather, and it produced some interesting results.
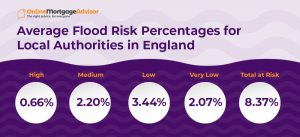
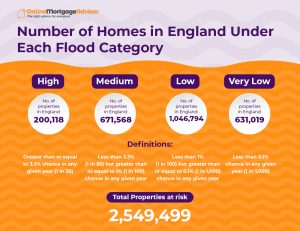
More than 2.5 million homes in England are situated in parts of the country that could potentially flood to some extent, although the number that were built in areas classed as ‘high risk’ stands at just over 200,000.
The image below shows how many properties in England are at risk from flooding from rivers and seas and explains what the different classifications of risk mean.
Homes in Boston and Skegness are the most under threat
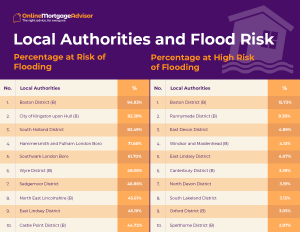
Houses in the Boston and Skegness constituency are among the most likely to be flooded. Just over 10% of properties in this area fall into the ‘high risk’ category, more than any other parliamentary constituency in England.
Only 10% of homes in the entire area are situated outside of potential flood zones.
There’s at least some risk to almost 90% of homes there as many of the other properties in Boston and Skegness fall somewhere between the ‘medium’ and ‘low risk’ bands, which is no doubt why flood alerts are common in Lincolnshire during extreme weather.
Other constituencies with a significant percentage of homes in the ‘high risk’ band include Runnymede and Weybridge at 8.05% and East Devon at 6.09%, while over 90% of properties in Kingston upon Hull’s East borough and West and Hessle borough constituencies fall into the ‘medium’ to ‘very low’ bands.
Analysing the data at the county level, East Yorkshire has the highest number of properties across all risk bands at 48.42%, although less than 1% of homes there are at ‘high risk’. The county with the highest number of homes in the most severe category is the aforementioned Lincolnshire at 2.48%.
Which areas are the least likely to be hit?
At the other end of the scale, London’s Camden and Islington boroughs are among the least at risk from flooding. None of the properties there fall into any risk category, and it’s a similar story in other built-up cities.
Breaking things down to the county level, Tyne and Wear has the fewest at-risk properties in general, with just 0.64% of homes falling into one of the four bands. Merseyside has the fewest in the ‘high risk’ category at 0.04%.
While it’s hardly shocking to hear that inner-city areas are less in jeopardy from rising water levels than coastal towns, further research throws up some interesting anomalies. For instance, government flood defence investment is highest in the south of England, despite this being a lower-risk region.
Spending per capita tops out at £180 in the South East, almost £100 more than Yorkshire and the Humber, home to Fishlake and Bentley, both of which were hit hard by flooding when torrential rain fell in November 2019.
Is climate change an important issue to the public?
We surveyed 902 random members of the English public through Google User Surveys. The results of the survey are below.
Whilst the sample size numbers just less than 1,000 respondents, it’s certainly enough to demonstrate that climate change is at least a significant and growing concern.
How do MPs in these areas vote on climate change measures?
As well as shedding light on the extent of the flood risk across England, our online tool also reveals whether there’s a correlation between the threat level and how MPs in each area tend to vote on climate change measures.
Somewhat surprisingly, holding a seat in one of the highest-risk areas doesn’t necessarily mean a politician is in favour of new climate change legislation. Matt Warman, Conservative MP for Boston and Skegness, has consistently voted against new climate change measures, as have his fellow Lincolnshire Tories Sir John Hayes, Victoria Atkins, Sir Edward Leigh and Dr Caroline Johnson.
Lincolnshire’s Labour MPs appear to be in favour of further legislation, with Nicholas Dakin and Melanie Onn voting for, although there is not enough data to establish a conclusive pattern for Lincoln Boro’s Karen Lee.
Meanwhile, Inner London MPs Keir Starmer, Emily Thornberry and Helen Hayes, all of whom are Labour, have steadfastly voted in favour of anti-climate change measures despite being based in low-risk parts of England. Inner London Tory MPs Mark Fields and Greg Hands typically oppose them.
Moreover, the counties of Merseyside and Tyne and Wear – two parts of the country where homes are safest from flooding – are Labour strongholds and MPs there unanimously vote in favour of climate change control, despite the relatively low threat rising water levels pose to their constituencies.
How the main political parties vote on climate change measures
Generally speaking, Conservative MPs have a track record of voting against fresh anti-climate change legislation. None have consistently voted in favour of extra measures, while 84% have always been opposed. A further 9% have turned in a mixture of ‘for’ and ‘against’ votes over the years and there is not enough data to establish a pattern for the remaining 7%
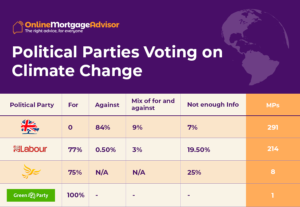
The majority of Labour MPs have voted for new climate change measures, with 77% consistently stating that they’re in favour. Less than 1% are opposed and only 3% have veered between ‘for’ and ‘against’ since being elected. There is not enough data to go off for the remaining 19.5%.
Like Labour, the Liberal Democrats are generally for climate change legislation, with 75% consistently voting in favour, although there is not enough data available to establish a pattern for the remaining 25% of their eight MPs.
Least surprising of all, the Green Party’s sole MP, Caroline Lucas, has always voted for the measures, giving them a ratio of 100% in favour.
Why have they voted this way?
Of course, it isn’t a simple case of saying the Conservative Party is opposed to climate change legislation and Labour is all for it. Although our data seems to suggest a lack of Conservative appetite for the measures tabled in recent years, it’s important to consider other factors beyond the raw numbers.
The Climate Change Act of 2008 received cross-party support but subsequent votes on how to implement its long-term goals have not received the same consensus. In the decade that’s passed since then, parties in power have been known to prioritise the economy over additional pro-climate measures.
Long-term emission-cutting goals have been given parliamentary support and the Conservative government actually tabled the proposal to make Britain carbon neutral by 2050 – many of their MPs have shot down short-term proposals but remain firmly behind the wider environmental targets.
Matt Warman, for instance, has been vocal in his support of the government’s 25-year plan for the environment, which includes the creation of ‘clean air’ zones and proposals to plant an additional 11 million trees by 2020.
There have also been times when MPs have confirmed that they opposed climate control legislation because the measures were not extensive enough.
On the whole, the majority of MPs vote with the party line on climate change, although there have been some notable exceptions. For example, several rebel Labour MPs voted in support of the Heathrow Airport expansion in 2018, despite the potential impact on the environment.
So, if the environment is a cause that might influence the way you vote in the upcoming election, it’s important to consider the bigger picture. Look at the long-term measures each party has pledged to support and consider the reasons why some of their MPs may have knocked back shorter-term legislation, even if their constituency is at risk of flooding.
Sources
Environmental Agency – RoFRS March 2019
TheyWorkForYou – MP voting data from August 2019
Although every effort has been made to ensure there have been no inaccuracies when integrating the raw data into the tool, as well as more recent changes in MP political party membership – the occasional small error may be present!
Online Mortgage Advisor is politically agnostic. We just find data interesting! We don’t support any specific party and this was built without any intent to sway any voters in any particular way.
